

Expedia Inclusion Diversity
Leading an Accessible Travel Transformation at Expedia Group
Opportunity
Travellers with disabilities represent a massive, underserved market, accounting for roughly 1.3 billion people globally and nearly $50 billion in annual US travel spend. Despite that value, they routinely face friction and uncertainty just trying to book a stay. Our internal assessment found that 33.5% of lodging stays for travellers with accessibility needs led to preventable bad experiences. The primary drivers were unfulfilled accessible room requests, inaccurate property descriptions, and unexpected physical barriers on arrival. At the same time, Expedia offered 4 to 7 times fewer accessible travel features than key competitors. Incomplete partner data and unreliable search filters were actively breaking customer trust and driving up expensive, avoidable customer support calls.
Approach
As design lead, I turned a fragmented, multi-team problem into a clear direction teams could execute against. I managed five designers, partnered with dedicated UX researchers, and pulled together a working group of content designers who volunteered from other teams because we had no dedicated content headcount. Because our team did not own the entire ecosystem, I focused on cross-functional influence across product, partner operations, customer service, and policy. We mapped the full journey to show how gaps in partner tools directly caused downstream booking failures and service escalations. To build alignment, I introduced "preventable bad experiences" as our primary metric. That grounded accessibility in product quality, customer harm, and business performance, backed by an 18-month strategy, competitor scorecards, and clickable prototypes.
Outcomes
Over six months, we delivered immediate operational wins while building the case for ongoing investment. We expanded accessibility search filters, driving an 80% increase in filter engagement and contributing to an estimated 12% drop in preventable bad experiences. We launched a content reporting tool on Vrbo that gathered 19,300 traveller reports on inaccurate listings, published a lodging accessibility guide to help partners submit accurate data, and drove a policy change defaulting properties to allow service animals in protected markets, scaling coverage from roughly 100,000 to 1.3 million listings. Beyond shipped features, the initiative established a clear roadmap and proved that inclusive design directly reduces support costs, protects marketplace trust, and drives business growth.
Lets noodle on the details
My Role:
I led design for a focused six-month effort to make travel meaningfully better for travellers with accessibility needs. This work wasn't a single feature or product refresh. It was an attempt to change how a large travel business understood, prioritised and delivered accessible experiences across the journey.
I managed four designers and partnered closely with a content strategist and five product managers. Together, we worked across customer-facing shopping and booking experiences, business-facing tools and guidance for lodging partners, customer support and service experiences, and the internal practices that shaped whether teams could design and ship accessibly.
As design lead, my responsibility was to turn a complex, fragmented problem into a shared direction: one the team could act on, partner and product teams could understand, and leadership could connect to customer harm and business value.
Focus areas
Dedicated support is ever-present - Travellers should feel supported throughout the journey, from researching and booking through the in-trip experience, with help available at key touchpoints and in accessible formats.
Help partners provide accurate accessibility information - Encourage partners to provide complete, specific, and trustworthy accessibility details so travellers can judge whether a property or room meets their needs.
Surface Relevant Properties and Rooms - Improve accessibility content and findability in the shopping experience, including complete property- and room-level amenities, so travellers can identify suitable options and make informed decisions.
Unique needs are always addressed - Make it easy for travellers to communicate and address their individual accessibility needs from the start of booking through the rest of the process.
Digital accessibility - Ensure websites, apps, content, tools, and digital systems can be perceived, operated, understood, and used by people with disabilities.
Leaving reviews is safe, accessible + impactful - Create a review experience where travellers feel comfortable contributing and understand how their feedback helps other travellers in the community.
Quarterly Planning Schedule
A human problem spread across a complex system
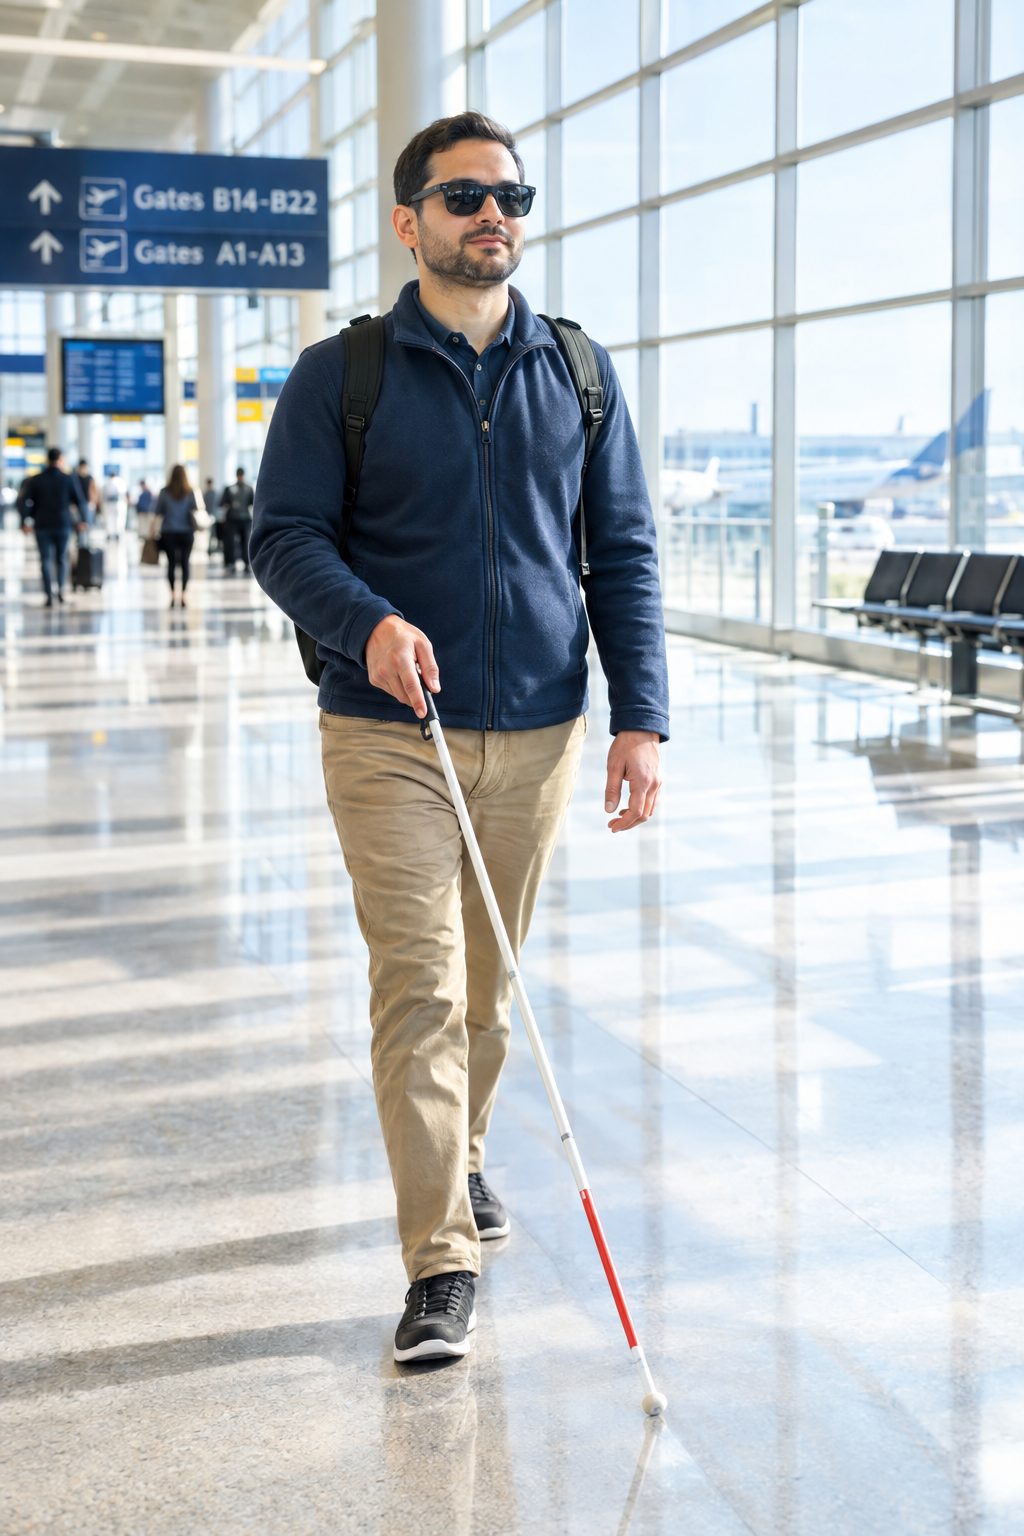
Travellers with disabilities were being asked to do far more work than other travellers before they could feel confident booking. They had to research accessibility in detail, interpret incomplete information, contact suppliers directly, and still face the possibility that what was promised wouldn’t be available on arrival.
That made accessibility both a human problem and a commercial problem. The audience was large, active and valuable, but the experience was fragmented across product design, partner content, policy, service and operations.
Why the opportunity mattered
1.3 billion people - An estimated 16% of the world’s population experience significant disability. [World Health Organisation]
28.7% of United States adults reported having a disability in 2022. [Centres for Disease Control and Prevention]
United States travellers with disabilities spend nearly $50 billion annually on travel. [Open Doors Organisation]
73% versus 62% Expedia Group research found that underserved travellers were more likely than the general population to book again with brands that promote inclusive practices. [Expedia Study]
The internal state-of-accessible-travel assessment that shaped our programme described a business materially under-serving this audience. It found that 33.5% of lodging experiences for travellers with accessibility needs were considered preventable bad experiences during the six-month period assessed. In the same assessment, Expedia's accessible travel features lagged behind several competitors, and activities and insurance offered little or no accessibility support in the customer experience.
The detail behind those numbers mattered. The largest lodging contributors included unfulfilled accessible-room requests, bedroom and bathroom barriers, property amenities, and service-animal policy requests. This was not a narrow compliance issue. It was a trust, product quality, content quality, customer support and growth issue spread across the full travel journey.
The leadership challenge
The problem was too broad for a conventional feature team and too urgent for a long research exercise with no delivery path. I had to help the team navigate four tensions at once:
Create a coherent strategy without pretending that one team could fix every part of the travel ecosystem.
Give four designers enough focus and ownership to move quickly, while keeping the work connected as one experience.
Influence teams we didn't directly manage, including product, content, partner, service, and policy stakeholders.
Balance immediate improvements with the longer-term changes needed to prevent the same problems from recurring.
How I led the work
I created a shared view of the journey. We mapped the experience from research and discovery through shopping, booking, supplier communication, travel and support. This helped the team see where a failure in one part of the system could create harm somewhere else—for example, when partner information was incomplete, product filters became unreliable and customer support inherited the consequences.
I organised the work around customer needs, not organisational boundaries. The team focused on a small set of connected opportunities: make support available throughout the journey; help partners provide accurate, specific information; make relevant properties and rooms easier to find; address individual needs early; improve digital accessibility; and make reviews safer and more useful for the community.
I introduced a common language for prioritisation. The preventable bad experiences measure gave teams a practical way to talk about customer harm. It moved accessibility out of a specialist or compliance-only conversation and into product quality, service performance and marketplace trust. [5]
I made strategy tangible. Rather than stopping at principles, we created an eighteen-month experience strategy, a competitor scorecard, product concepts, partner guidance and an emerging measurement approach. These artefacts gave leadership and delivery teams something concrete to react to and improve.
I led through influence. The team did not own every dependency, so progress depended on alignment. I used evidence, prototypes and clear trade-offs to help stakeholders understand what was at risk, what could be delivered now and what required longer-term investment.
Workstreams
Traveller experience: Improving how travellers found relevant properties and rooms, understood accessibility features, requested support and reported harmful or inaccurate content.
Lodging partner experience: Helping partners provide clearer, more complete and more trustworthy accessibility information, including guidance on accessible amenities and room content.
Customer support and service: Making support needs easier to express and helping the service experience respond to the reality of accessibility-related questions and failures.
Internal capability: Supporting research, personas, training, digital accessibility guidance, and design-process improvements so accessibility becomes part of normal product work rather than an exception.
Preventable bad experiences
Preventable bad experiences became the team’s main measure of customer harm. In simple terms, these were moments when a traveller with accessibility needs had a worse experience because the product, content, partner setup, service model, or policy didn’t work well enough.
It gave the team one shared way to define harm across the journey.
It helped us prioritise where design could have the greatest impact across customer-facing and business-facing experiences.
It created a direct link between strategy work and measurable business outcomes.
It showed why we had to address search, booking, partner content, service handling, and in-stay confidence together.
The data also exposed operational consequences. During the period assessed, 31% of flight requests made at booking were wheelchair-related. The internal analysis estimated that approximately 78% of those requests led to customer contact, creating about $250,000 in annual call-handling cost.
The Biggest Preventable Bad Experiences for Travellers
One of the clearest ways we made the problem visible was by identifying the biggest preventable bad experiences for travellers with accessibility needs, then tracing how many of those failures were being created upstream in partner tools, content systems, and operating policies.
The most common issues were not edge cases. They recurred across booking, arrival, and in-stay experiences.
-
Special assistance (room request) - 17%
Accessible room requests were not fulfilled, or travellers were given accessible rooms they had not requested.
Sources used: voice-of-customer data, post-stay reviews, and chat data.
Bedroom accessibility - 15%
Travellers arrived to find bedrooms that did not meet their access needs, including first-floor access and bed-height issues.
Sources used: voice-of-customer data, post-stay reviews, and chat data.
Property amenities - 13%
Missing or broken elevators and difficult access routes made the property itself unusable for some travellers.
Sources used: voice-of-customer data, post-stay reviews, and chat data.
Bathroom accessibility - 12%
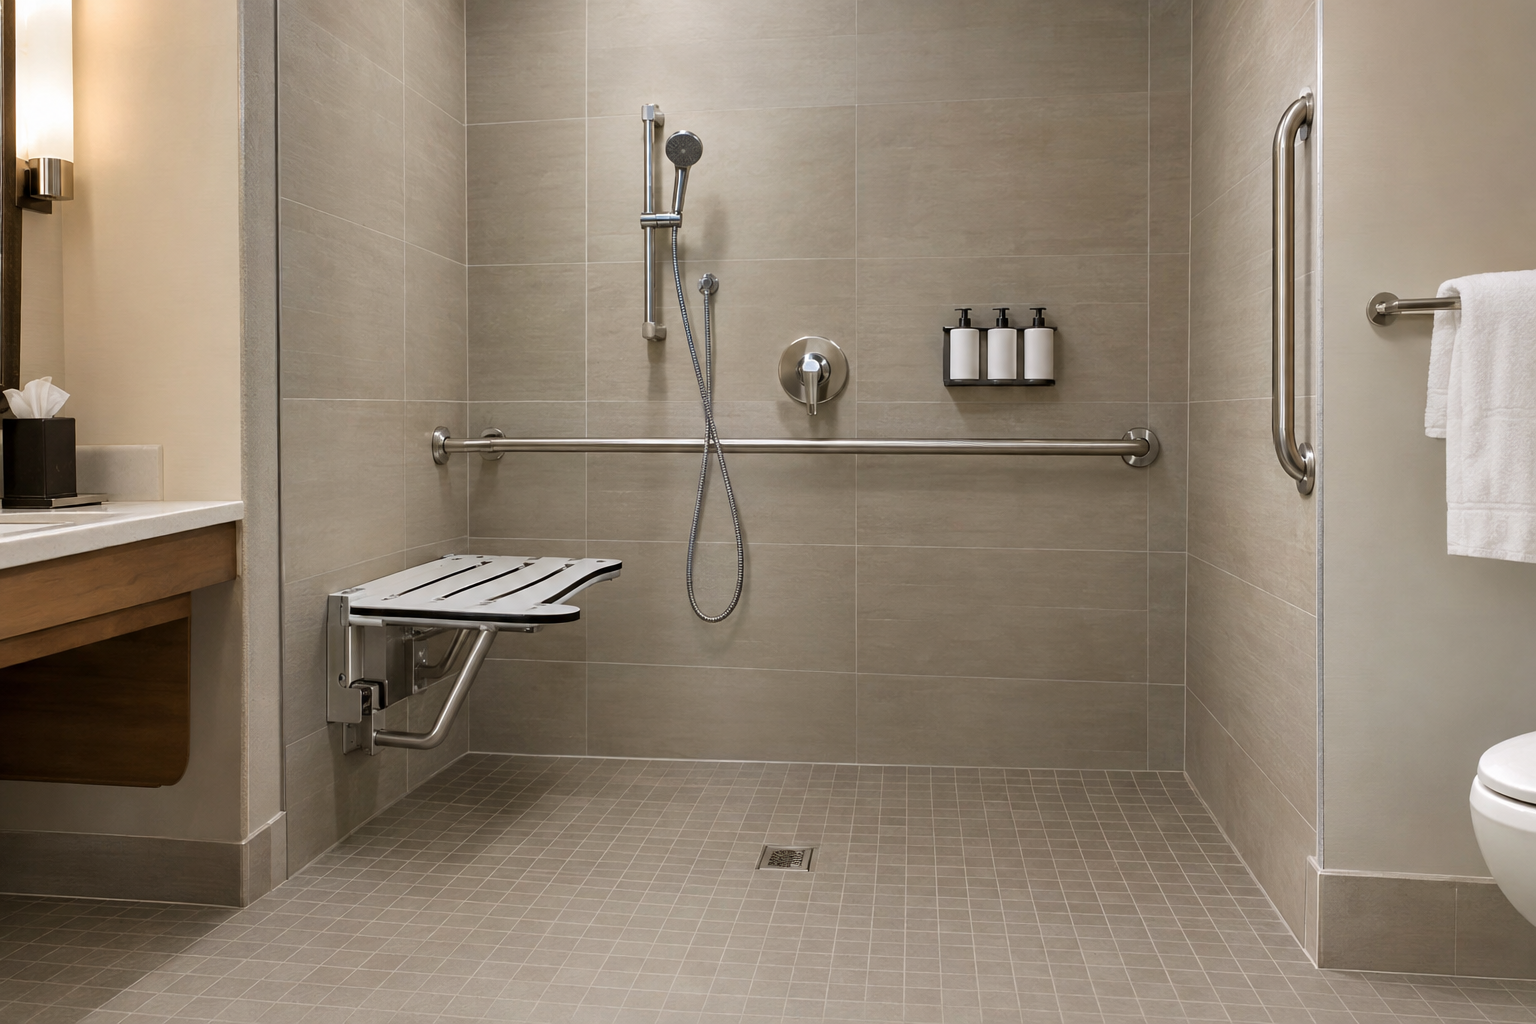
Bathrooms lacked critical features such as grab rails, shower benches, roll-in showers, or sufficient doorway clearance.
Sources used: voice-of-customer data, post-stay reviews, and chat data.
Service animal policy requests - 6%
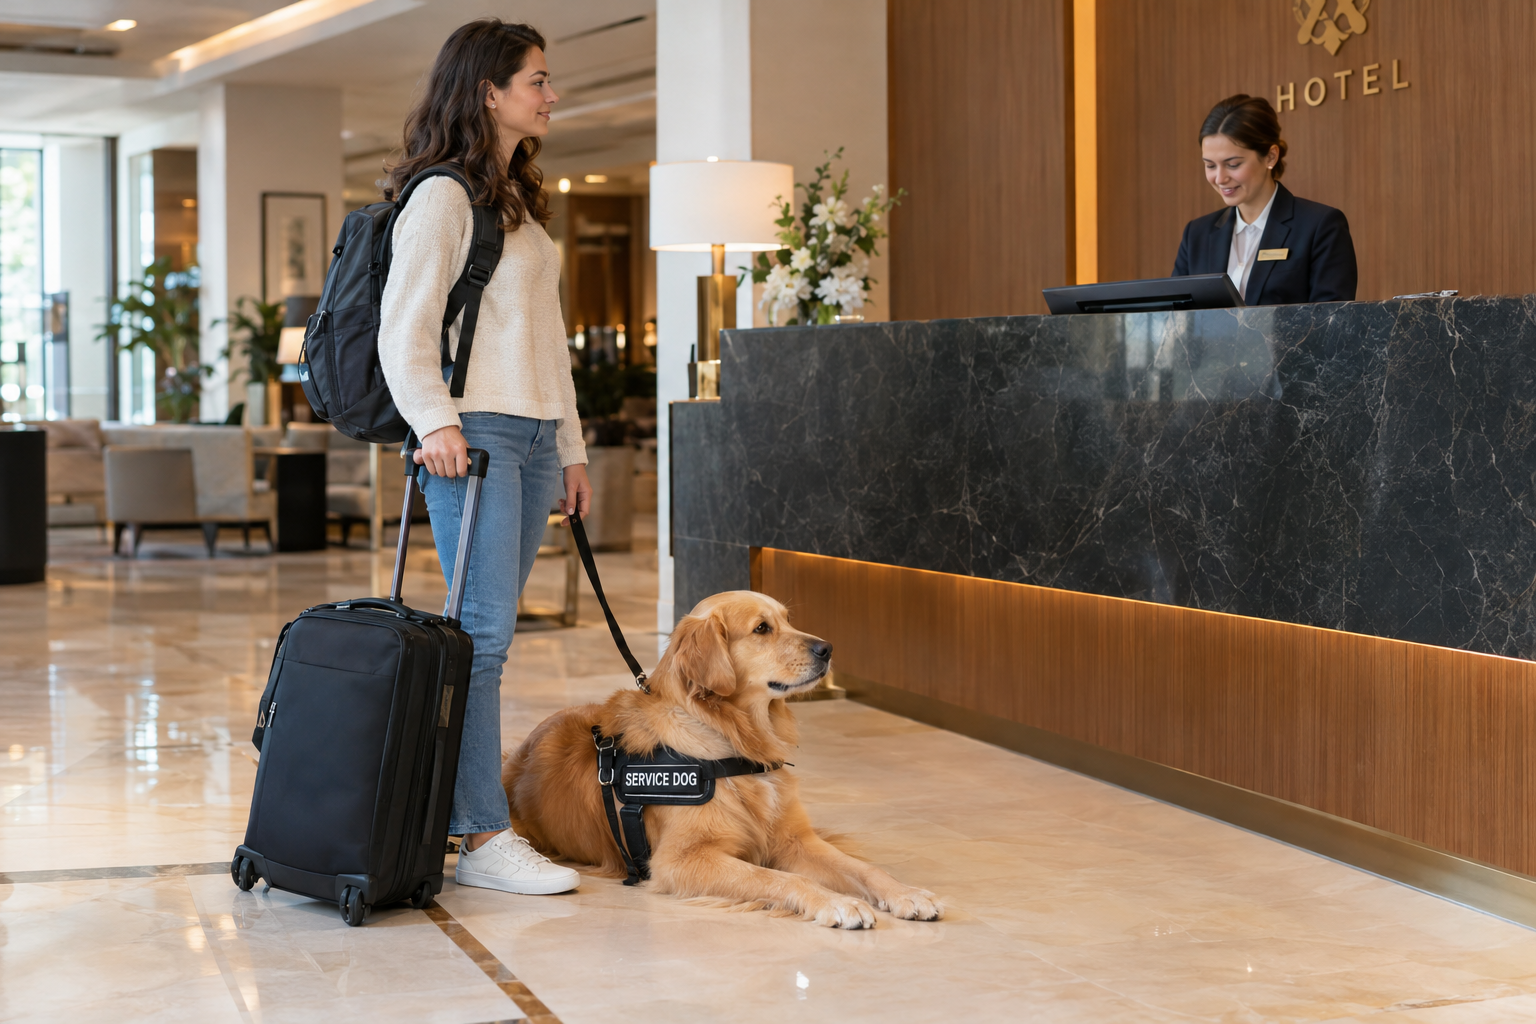
Travellers faced extra fees, paperwork requests, rude treatment, or rejected bookings when travelling with a service animal.
Sources used: voice-of-customer data, post-stay reviews, and chat data.
Wrong room or unintended accessible room assignment - 6%
Travellers were sometimes given the wrong room, including accessible rooms they had not asked for.
Sources used: voice-of-customer data, post-stay reviews, and chat data.
Communication accessibility - 5%
Deaf travellers and travellers with hearing or speech impairments struggled to get support through existing service channels.
Sources used: voice-of-customer data, post-stay reviews, and chat data.
Special assistance personnel - 5%
Travellers asked for support that was unavailable, inconsistent, or difficult to access at the property.
Sources used: voice-of-customer data and post-stay reviews; no meaningful chat signal was noted.
Parking accessibility - 3%
Parking was limited, too far away, or otherwise difficult to use for travellers with accessibility needs.
Sources used: voice-of-customer data, post-stay reviews, and chat data.
General site usability - 2%
Some travellers found the site difficult to navigate, scroll, or type through because of physical access needs.
Sources used: voice-of-customer data; no meaningful post-stay review or chat signals were noted.
-
Accessible traveler attributes
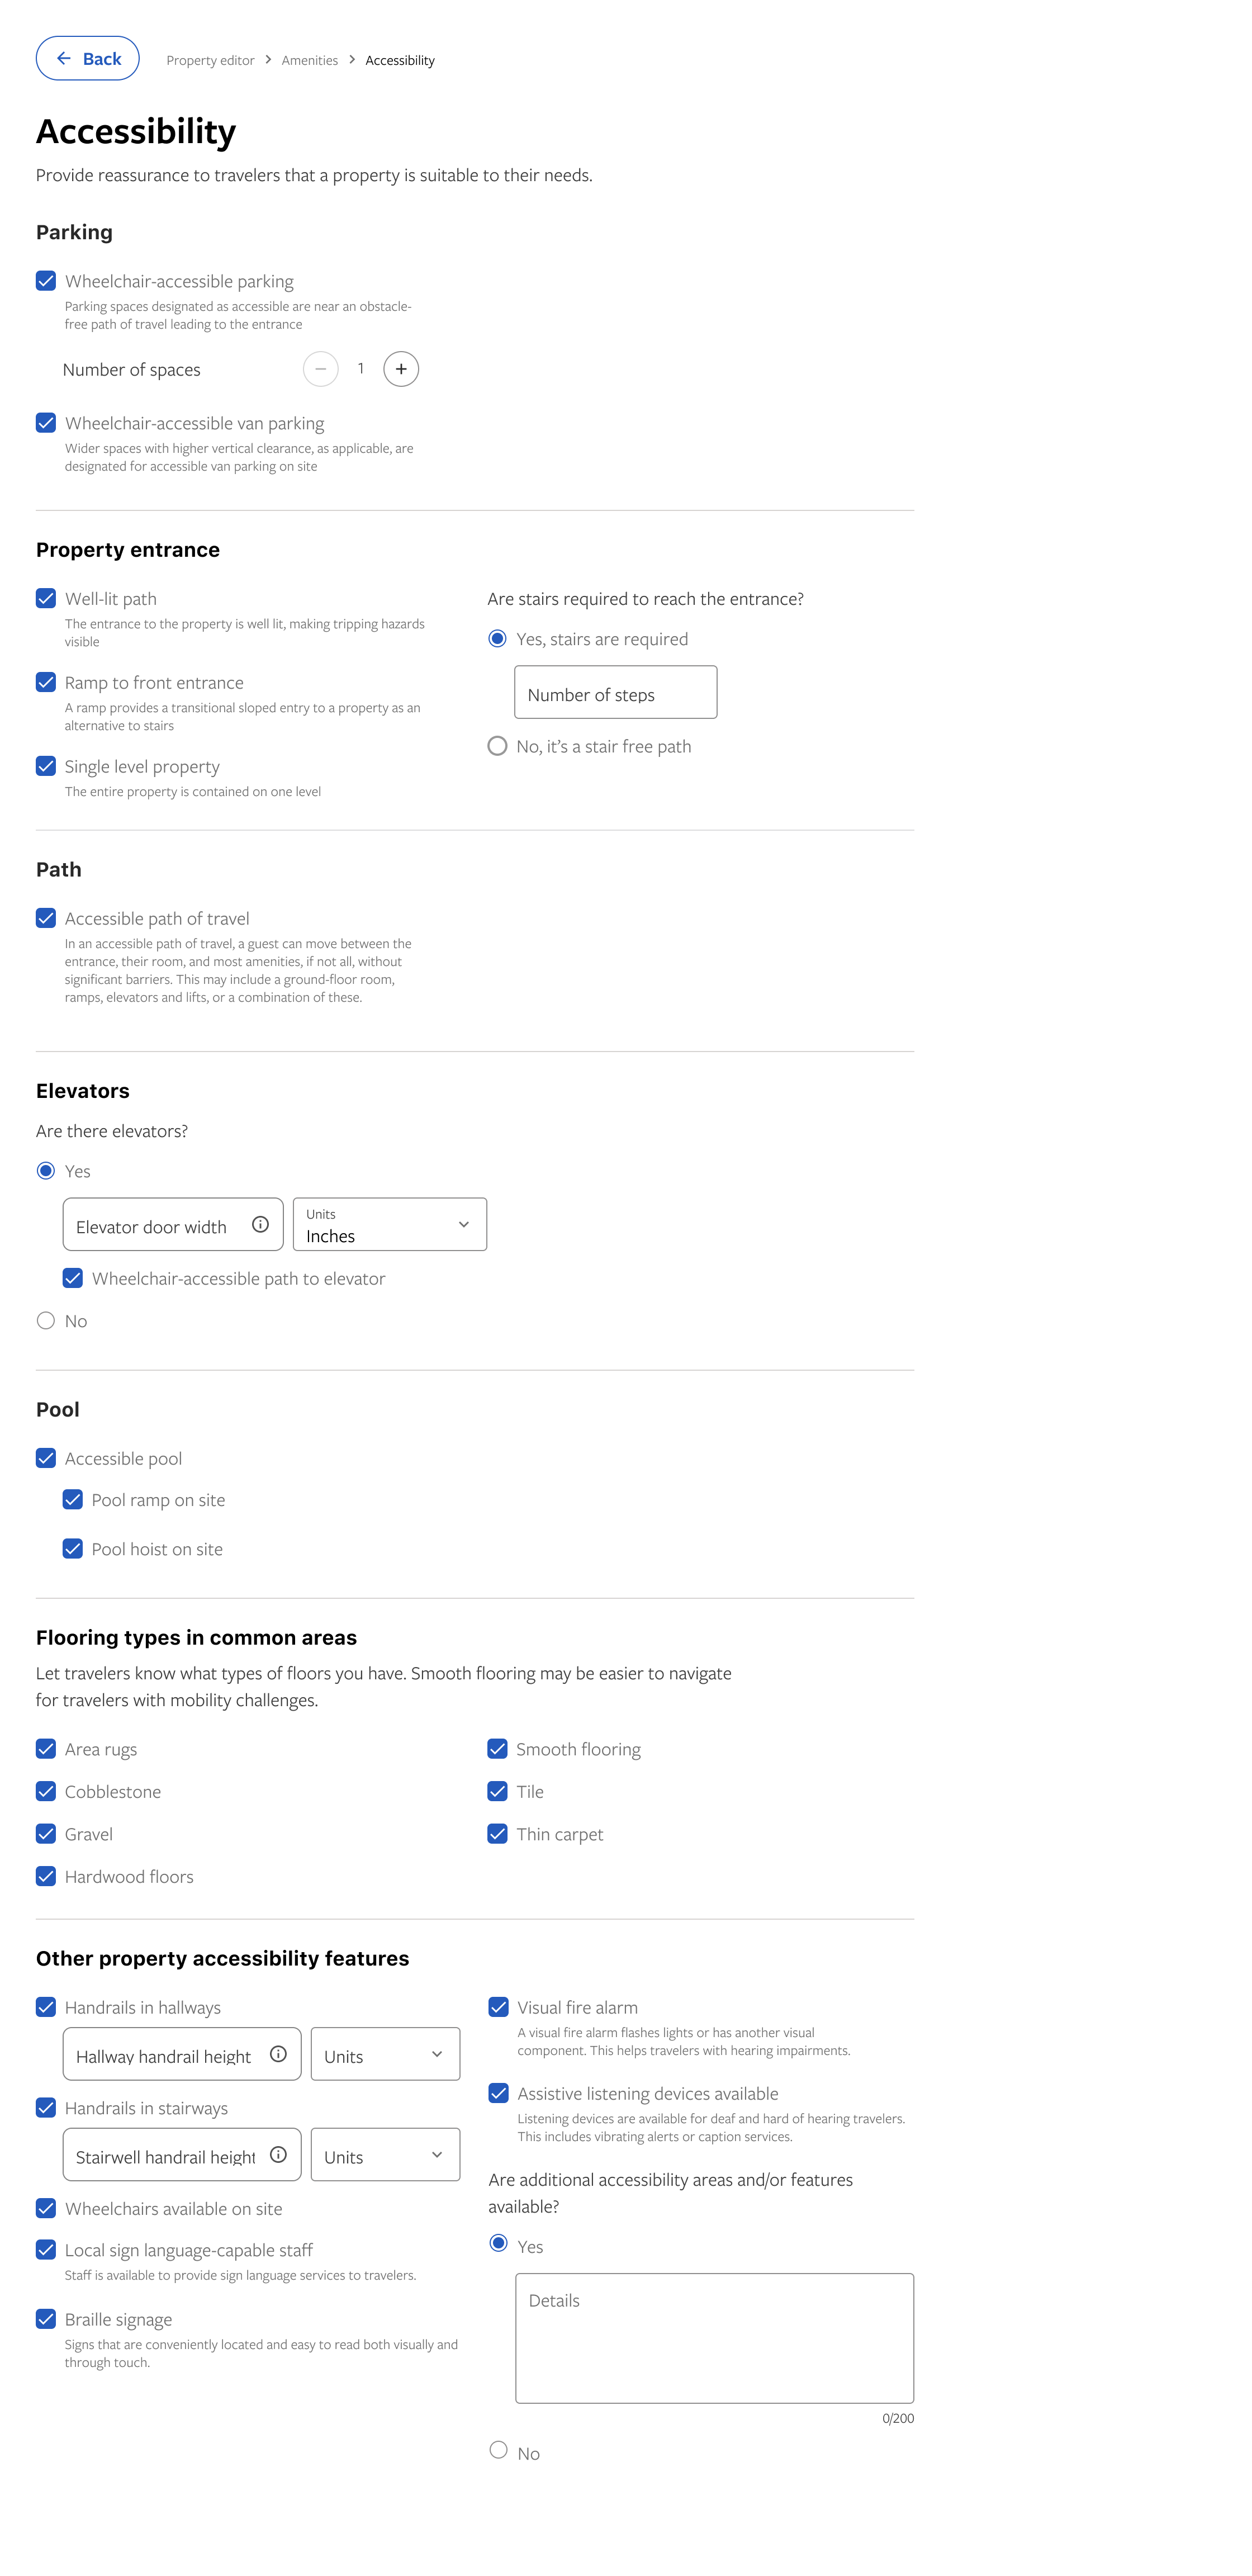
The partner system supported 53 property-level accessibility attributes, but only 8 were connected to live traveler-facing filters, and only 10 property-level accessibility amenities appeared on more than 50,000 properties.
Source used: partner-tool and attribute coverage analysis in the State of Accessibility Travel Report.
Accessible rooms
There were 51,914 properties with an accessible room and 113,858 active accessible rooms, yet 5% of those properties were still missing core property-level and room-level accessibility attributes.
Source used: room inventory and attribute coverage analysis, February 2022.
Accessible travel requests
Partners were receiving 50 to 100 accessibility-related feedback requests every two weeks, and volume was rising 16% year over year. The top request was help changing an accessible room name.
Source used: partner feedback request analysis.
Accessible travel photos
57% of travelers said detailed photos gave them confidence to book, yet only 4,046 properties had at least one accessibility-tagged photo. Just 2,565 properties had a property-level accessibility photo tag, and only 1,481 had a room-level accessibility photo tag.
Source used: traveler confidence research and accessibility photo coverage analysis, January 2022.
Partner education and ease of use
Tens of thousands of properties still stated that they did not allow service animals in countries where refusing them was illegal, and partner interviews showed that some properties avoided listing accessible rooms because they feared misuse, operational complexity, or delayed notifications.
Sources used: policy review, partner interviews, and partner workflow analysis.
Expedia Inclusion and Diversity Archetypes
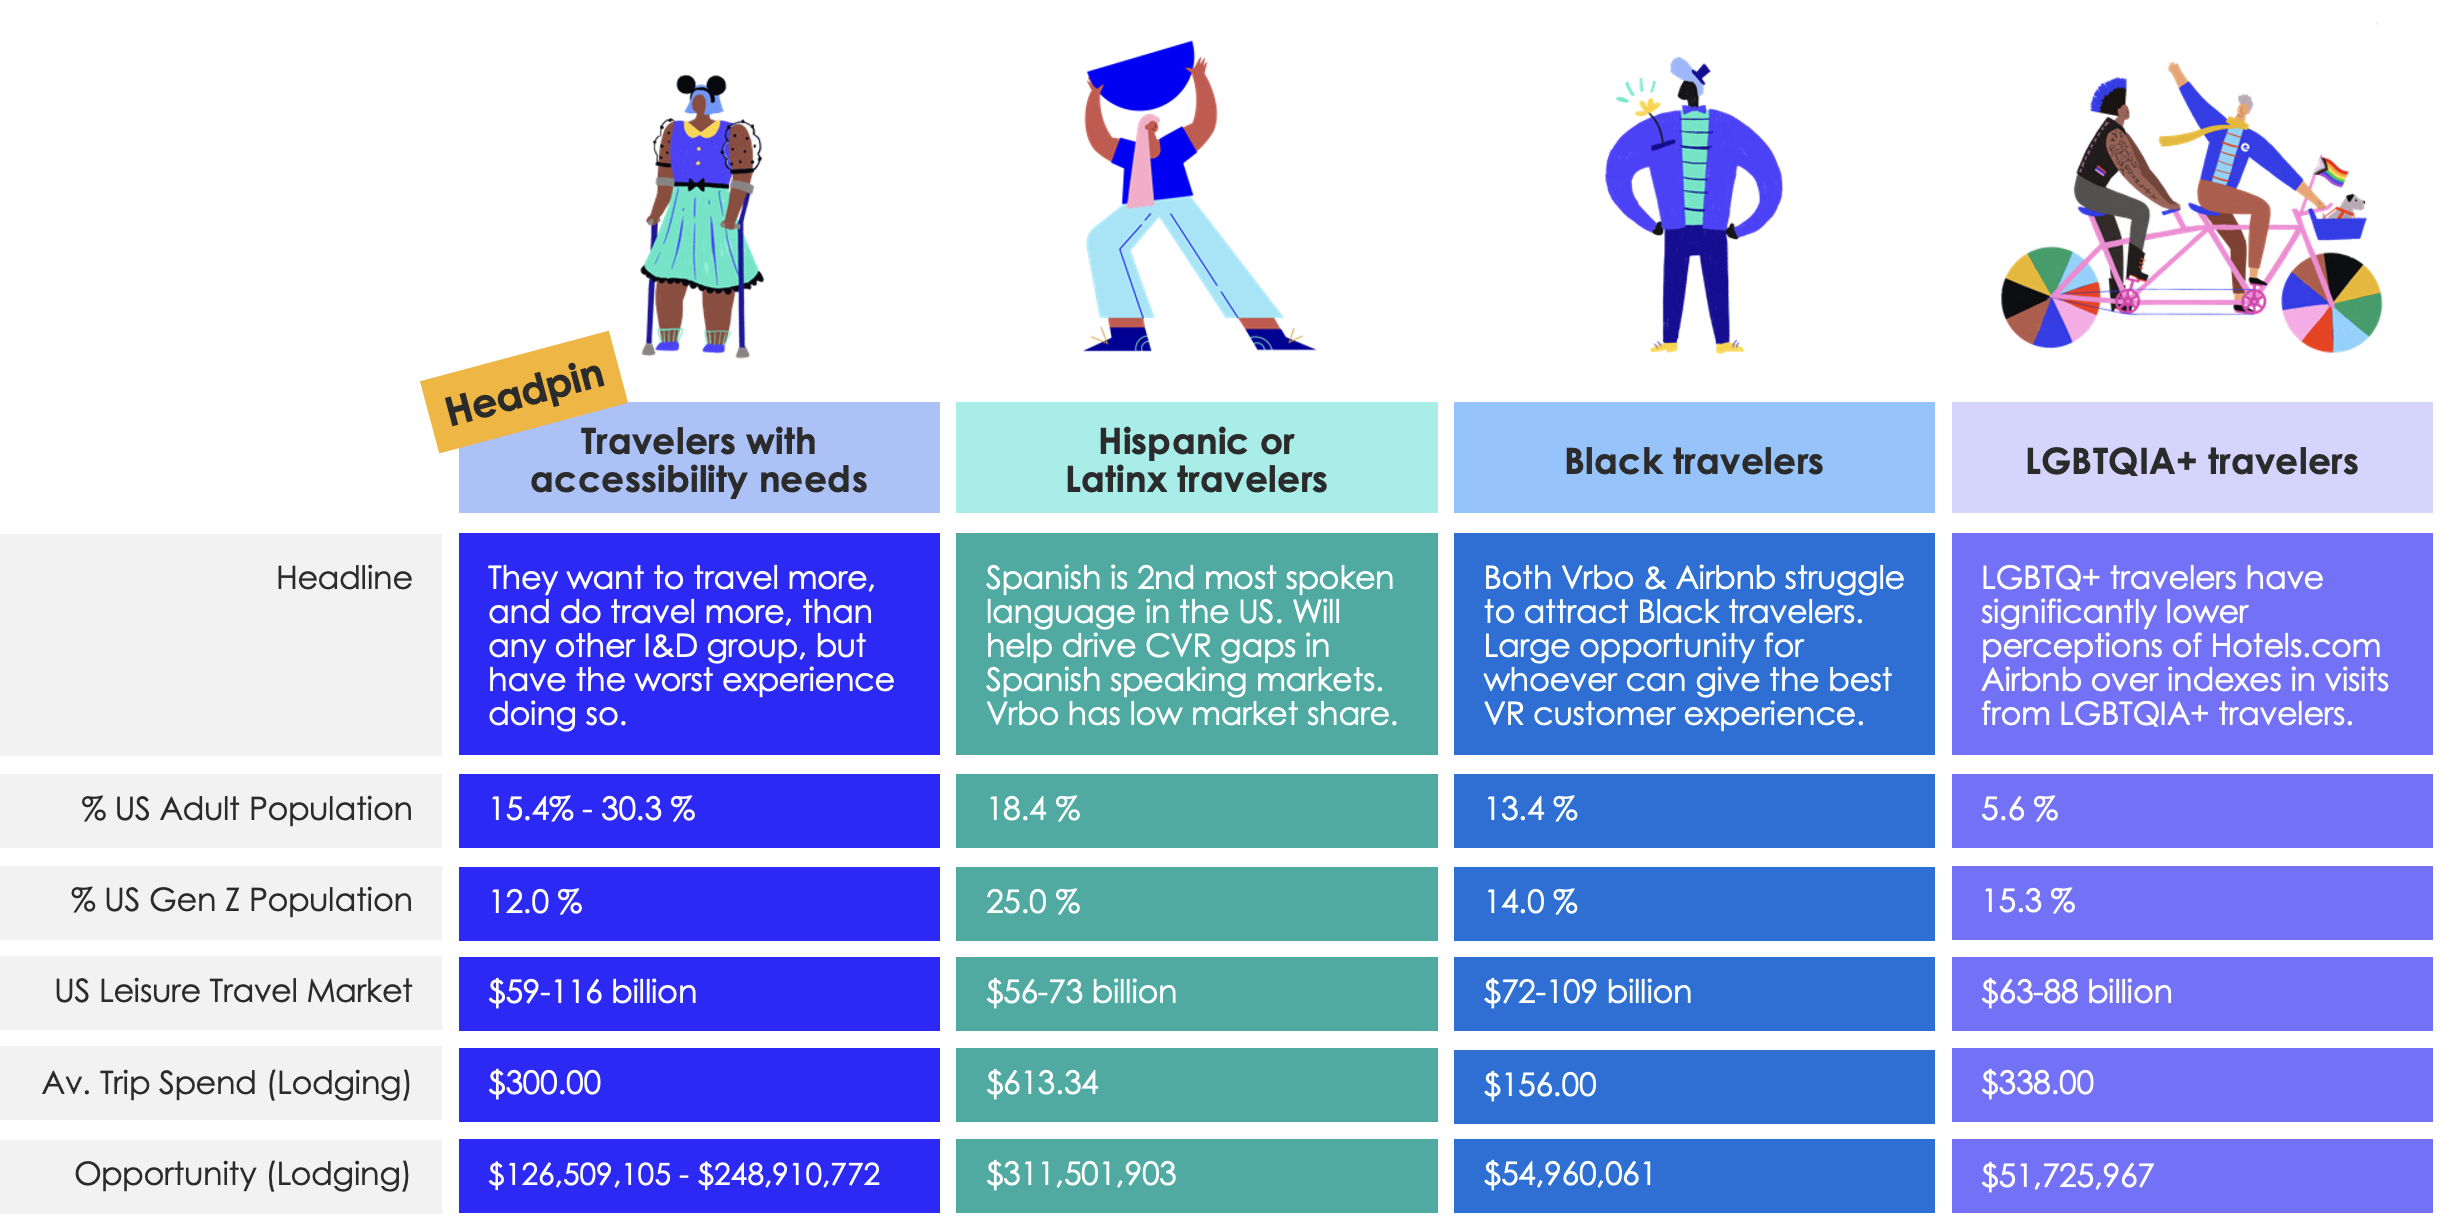
Expedia Group created four Customer Inclusion and Diversity (CI&D) priority archetypes to help teams decide which customer problems to focus on and which perspectives to use when prioritising work. They were developed through the CI&D playbook by combining market focus, research, brand performance signals, and opportunity sizing. The work focused on the US first, as Expedia Group’s largest market, and also considered the changing make-up of future travellers, particularly Gen Z.
The four priority archetypes are:
Travellers with accessibility needs
Hispanic or Latinx travellers
Black travellers
LGBTQIA+ travellers
The headpin archetype is travellers with accessibility needs because this is the largest inclusion and diversity group in the US and one of the most underserved in travel. Expedia Group identified accessibility as the best place to start because improvements here can also benefit many other underrepresented travellers.
Expedia Group prioritised the other three archetypes because of their scale in the US market, their growing importance within Gen Z, and clear gaps in current travel experiences. Together, these archetypes gave Expedia Group a practical way to focus inclusion and diversity work where it could have the greatest customer and business impact.
Travellers With Accessibility Needs
This segment is inclusive of Individuals with disabilities across all archetypes
Mobility
Cognitive
Visual
Auditory
Medical
Who are planning travel with/for travellers with disabilities
Family members
Caregivers
Companions
Meet Joel
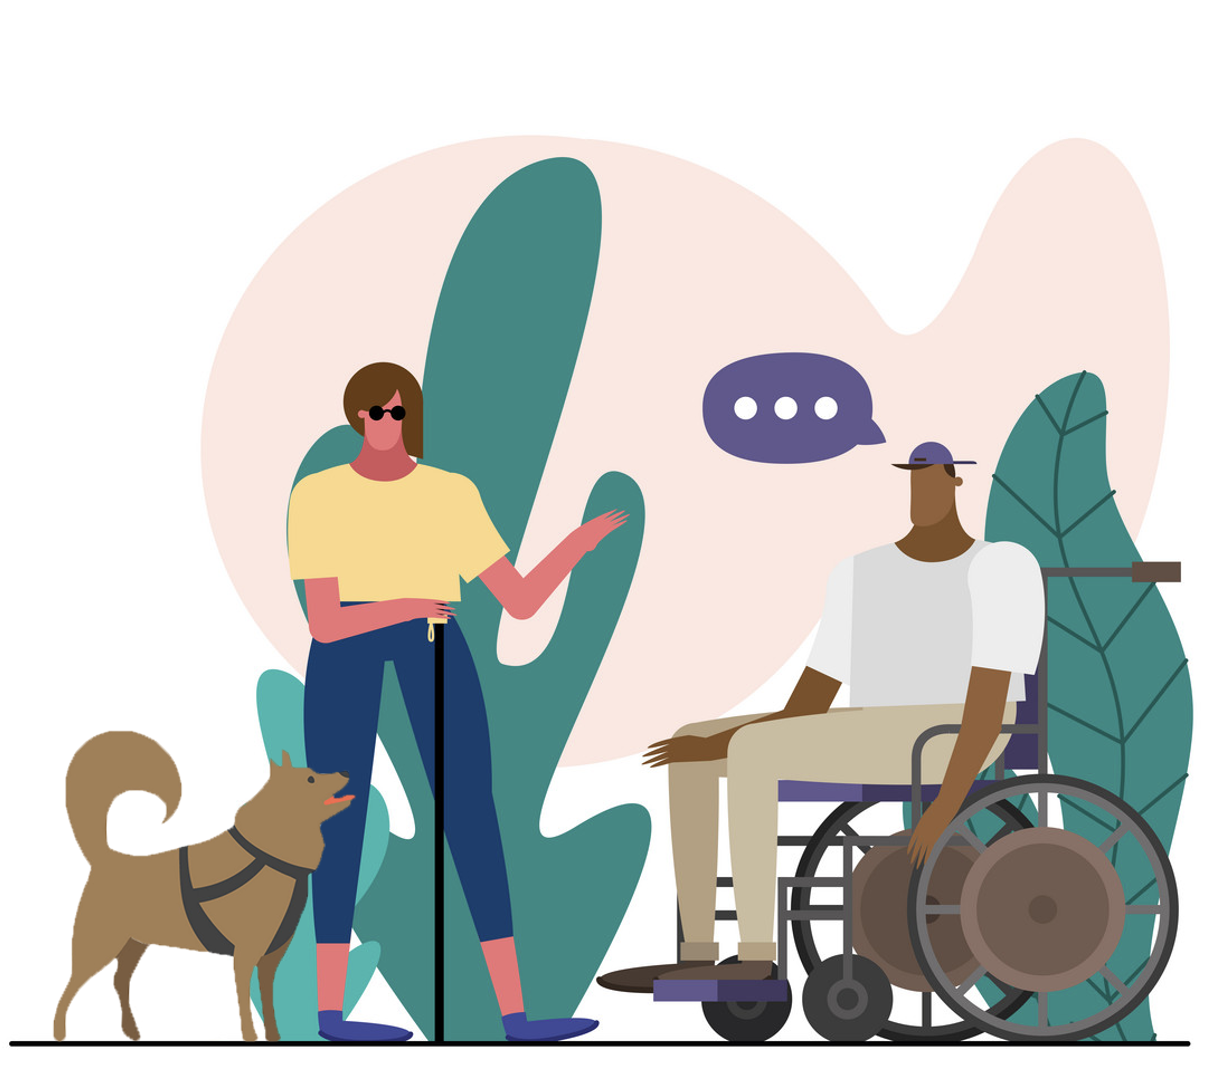
Jose is a wheelchair user from Austin, flying to New York for a long weekend with his partner, Maria, who has low vision and her service dog, Busan.
They are looking for a property in Manhattan that meets their accessibility needs.
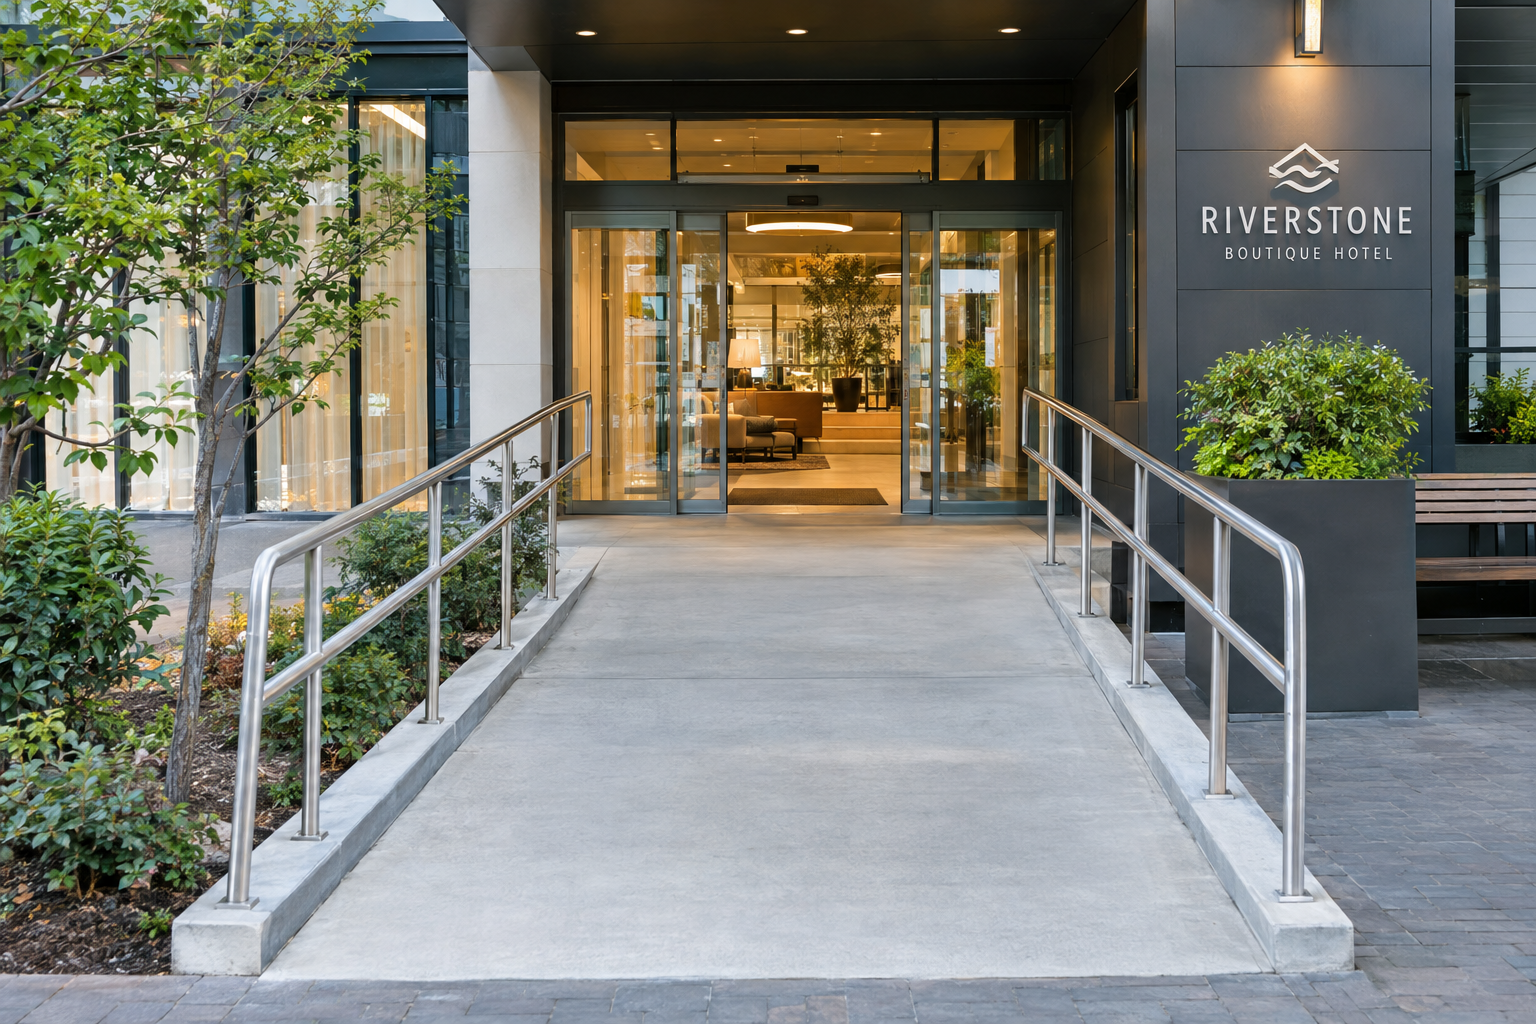
Jose and Maria have had bad experiences using public transport and taxis in New York before and have decided to rent a car for this trip. They need a property that has wheelchair accessible parking.
Expedia launched a new accessibility filter this year, making it super easy for Jose to find properties with wheelchair accessible parking.
Jose has selected a Hilton hotel with accessible parking in Manhattan. He needs to check whether the property meets his other accessibility needs.
Expedia knows accessibility information is important to Jose, so the accessibility information is much easier for Jose to find.
In one tap of the ‘Accessibility’ menu button, Jose is taken straight to all the accessibility information for this property in one place.
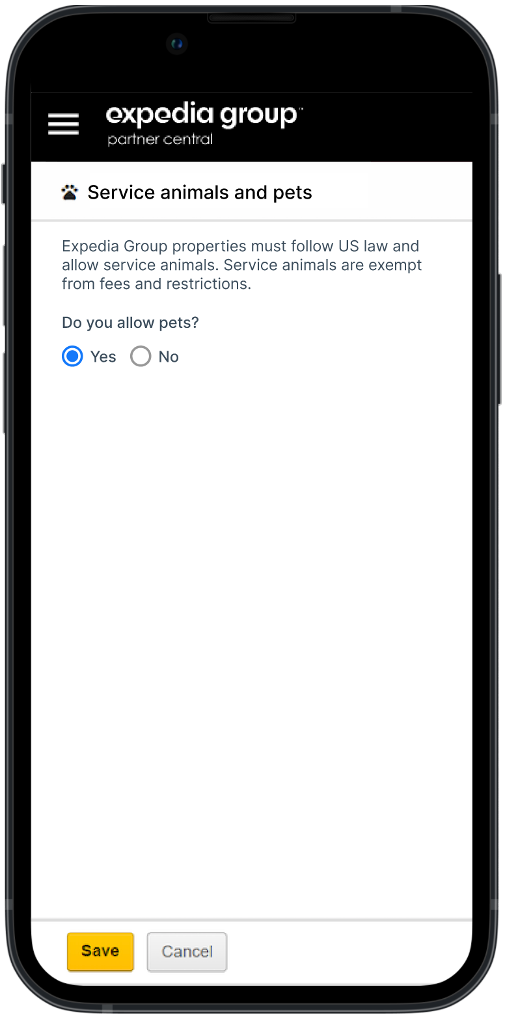
Until recently only 2% of Expedia properties allowed service animals, with 97% not giving a preference in Expedia Partner Central.
Now, any property that allows pets will automatically opt-in to allowing service animals too, going from 100,000 to 1.3 million EG properties allowing service animals.
Jose wants to know if the Hilton allows service animals at the property. All properties in the US must legally allow service animals, but Maria has had some bad experiences where her service dog Busan has been refused entry.
Jose and Maria now have a larger choice of properties through Expedia than ever before, that tell them upfront they do allow service animals.
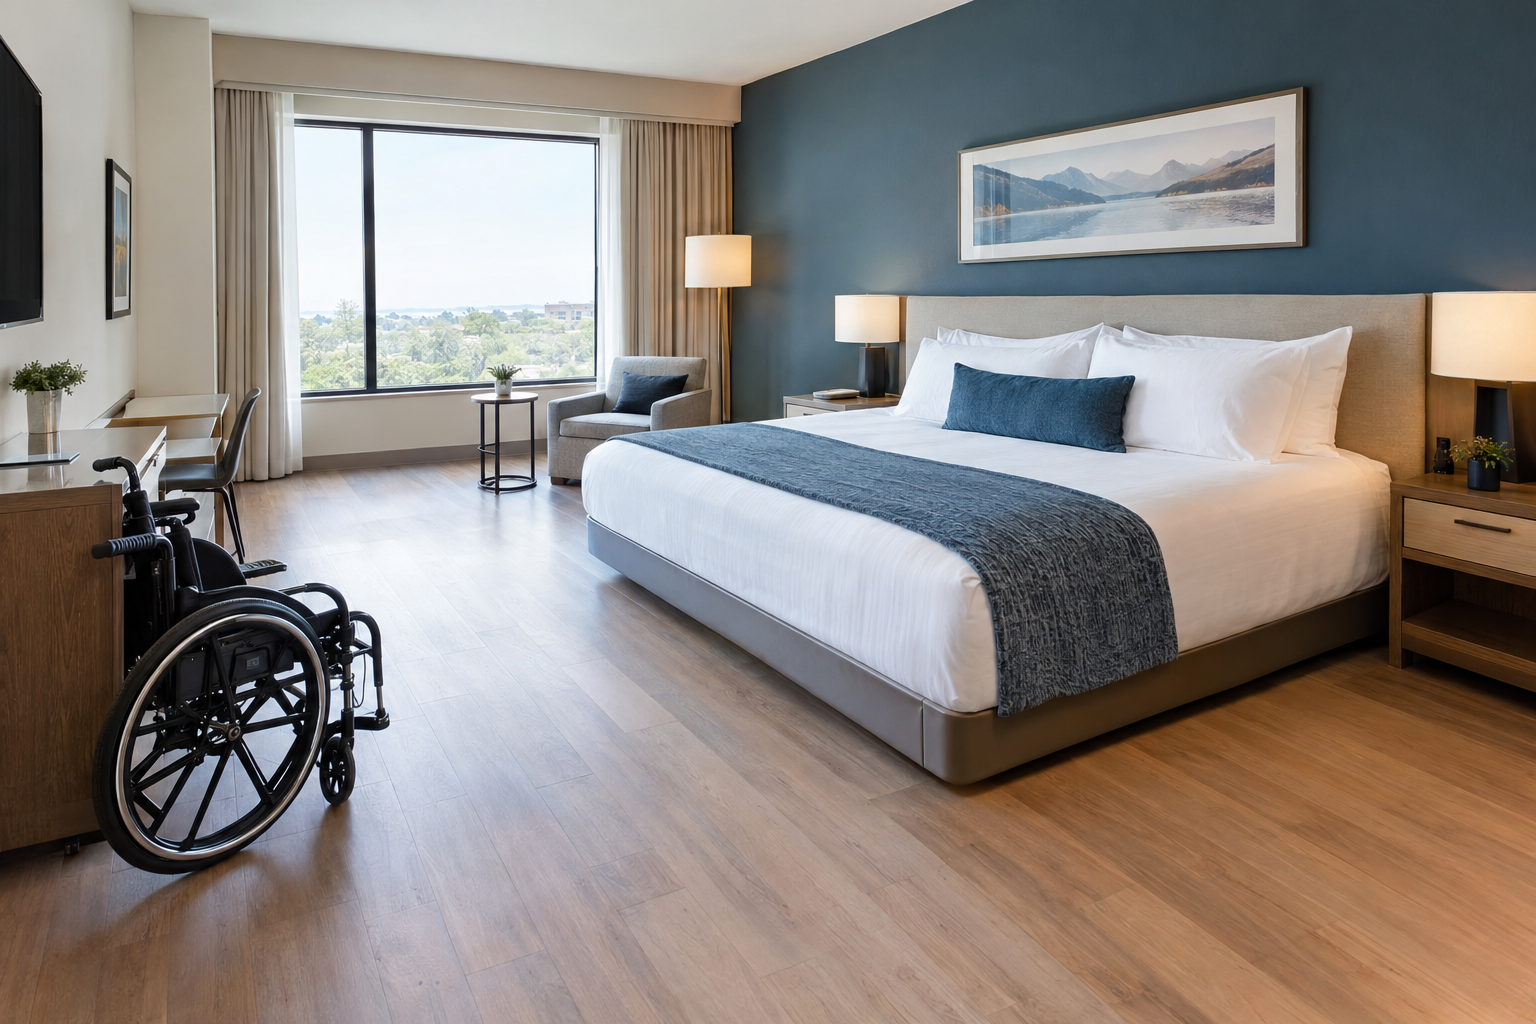
Jose needs a wheelchair accessible bathroom with a roll in shower. Jose opens up an accessible room, but cannot see a roll in shower listed in the room amenities.
Jose can report inaccurate content to Expedia through Expedia’s new content reporting capabilities. Expedia will investigate Jose’s report and work with the partner to resolve this issue.
Impact in Six Months
Strategic outcomes
Built the first comprehensive experience strategy for travellers with accessibility needs.
Created an eighteen-month view that connected immediate improvements to longer-term transformation.
Introduced an accessible travel competitor scorecard and a clearer view of customer harm across the journey.
Strengthened alignment across design, product, content, partner experience, service and policy-related work.
Tangible outcomes
Launched reporting capabilities that enabled travellers to report offensive, fraudulent or inaccurate content, resulting in 19,300 reports in the several months after launch
Expanded accessibility filters. The internal report recorded an 80% increase in engagement with accessible filters after the options were expanded.
Launched a lodging accessibility guide to help partners provide clearer definitions, guidance and best practices for collecting and entering accessibility information.
Completed a content analysis and guidance on the evolution of accessibility information and how it's displayed to travellers.
Opened research in areas the company had not previously explored in depth, including partner accessibility and inclusive reviews.
Developed accessibility landing-page concepts, product prototypes, and early work to capture accessibility needs within a universal traveller profile.
Not every idea was fully scaled within six months. That distinction matters: the team delivered early improvements while also creating the strategy, evidence, and design direction needed for the next stage of work.
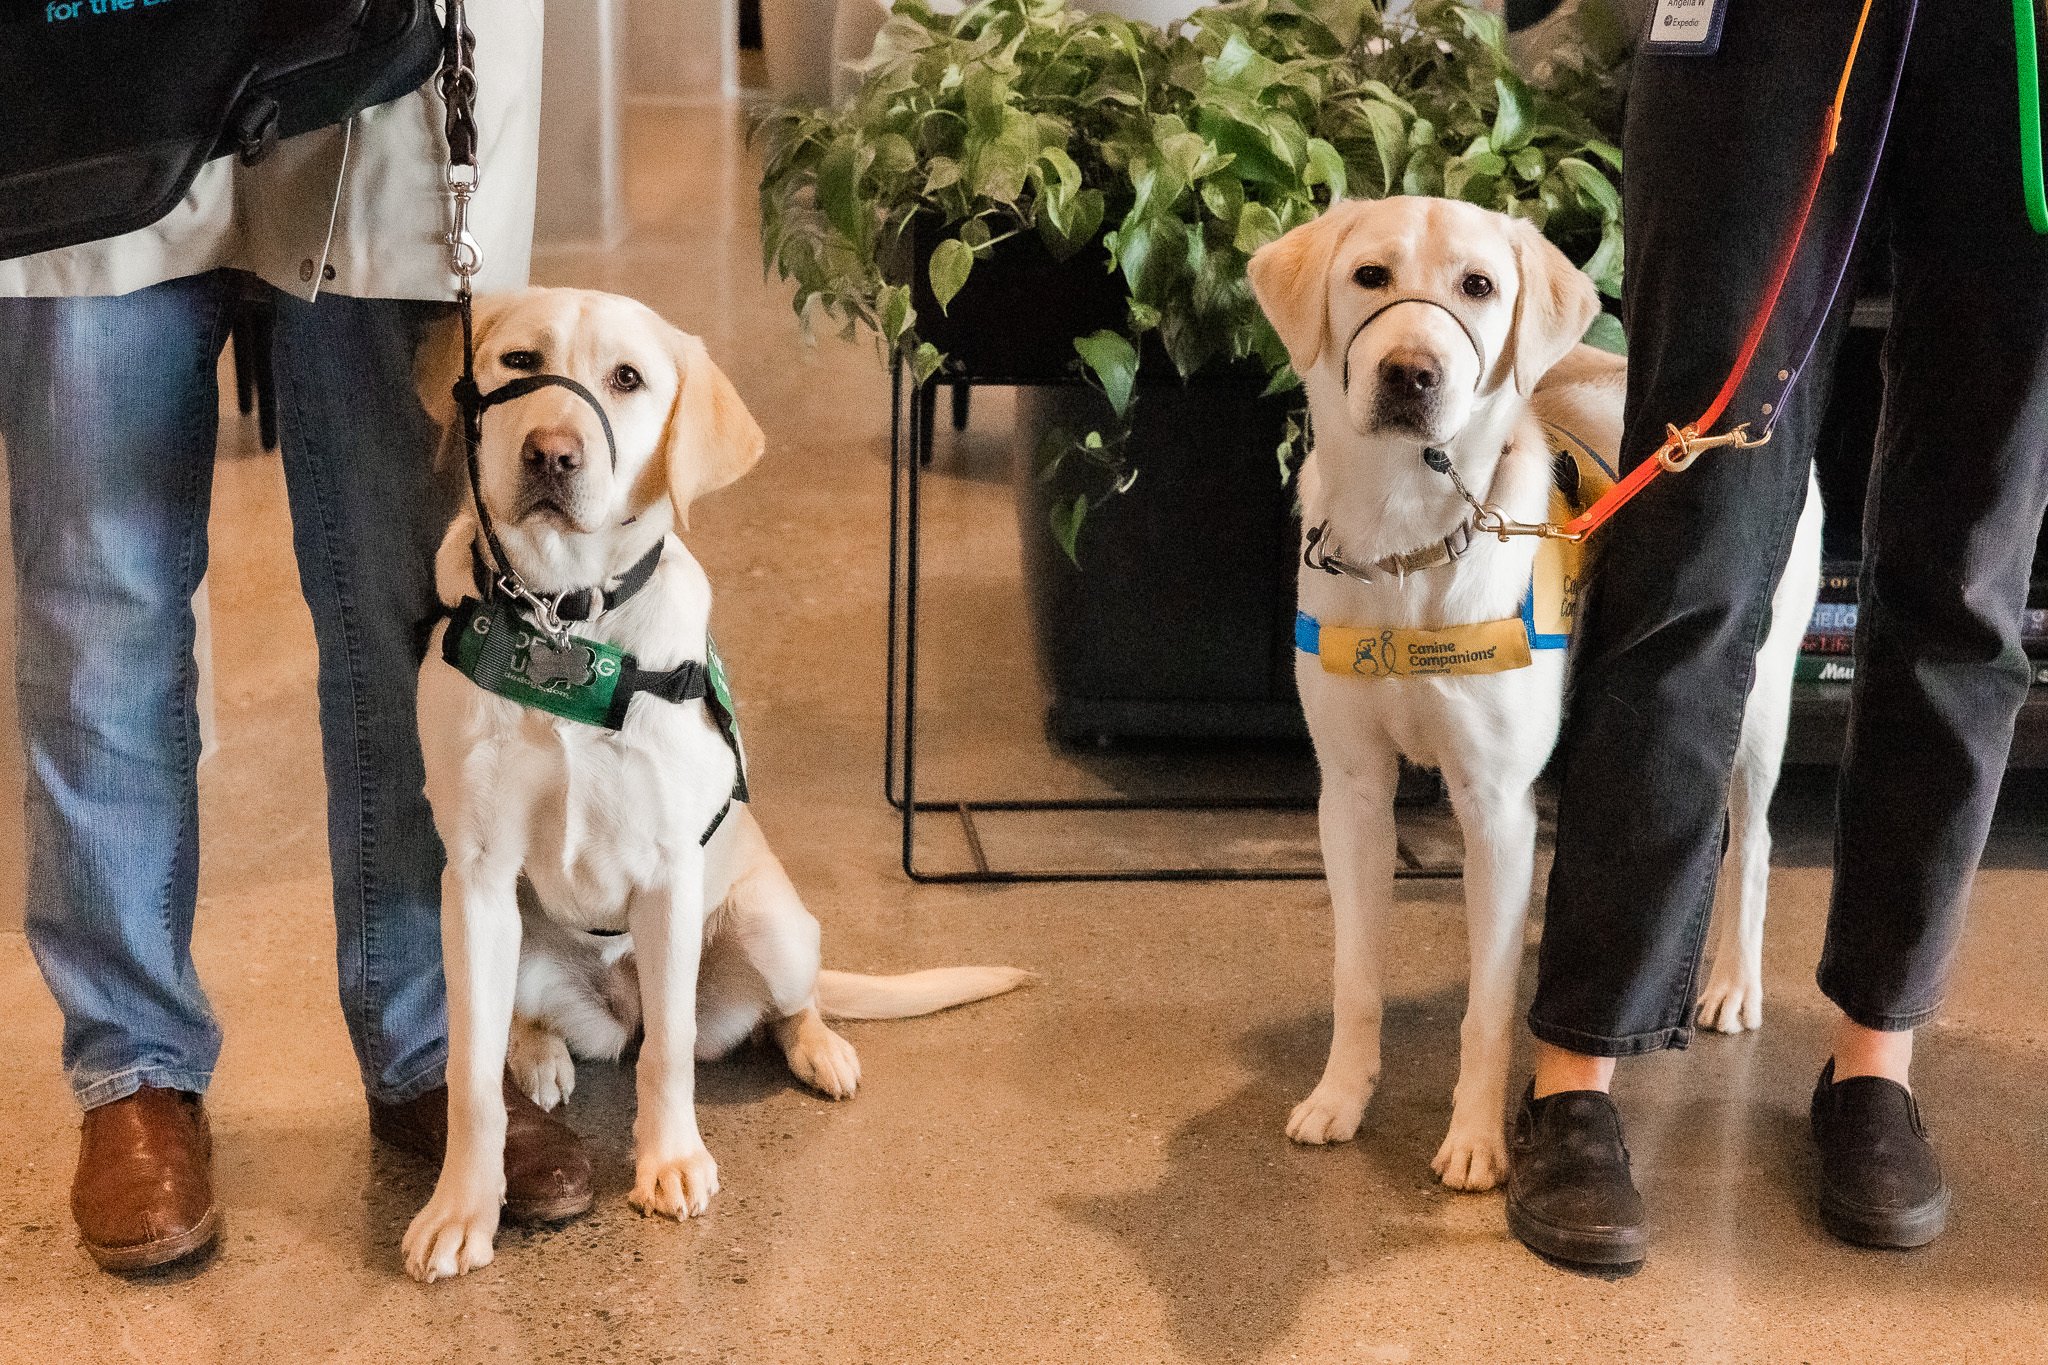
Highlight: Service Animals
This is a strong example of how the team worked: bringing together research, policy expertise, service design, partner experience, and product design to remove a significant, measurable barrier. The service-animal work is one of the clearest examples of the scale and impact of the team’s contribution.
We identified service animals as an 8% contributor to preventable bad experiences in lodging.
In key countries, 97% of properties had not stated whether they allow service animals.
That gap created both customer trust problems and legal risk.
The proposed change was to default properties to allow service animals in countries where service animal access is protected by law.
The expected effect was to increase visible support from roughly 100 thousand properties to about 1.3 million properties.
Program Pause
After six months, the programme paused during a reorganisation as design resources shifted to other areas of the business. By then, the work had moved beyond diagnosis: we had established the strategy, created an eighteen-month action plan, launched early improvements, and built a shared measurement model for accessible travel.
As design lead, I made the implications explicit in my update to leadership. I separated what we had already delivered from what was still in development, then outlined what the business would lose if the work stopped before the roadmap had time to compound.
Why the problem still mattered
The pause did not remove the underlying risk. It delayed a clear, evidence-based roadmap to reduce customer harm, improve marketplace trust, lower avoidable service costs, and close a visible competitive gap.
Travellers with accessibility needs were experiencing nearly twice as many preventable bad experiences as travellers overall.
The company lagged competitors by 4.3 to 7.8 times in the number of accessible travel features it offered.
Wheelchair-related requests made up 31 per cent of flight booking assistance requests, costing roughly $250,000 annually in call-handling.
Only 1.3 percent of accessible rooms had a photo showing an accessible room amenity.
The company also lacked internal readiness: only 11 percent of the design team and 5 percent of engineering had completed mandatory digital accessibility training, and there had not been a dedicated internal study with travellers with disabilities since 2017.
What the program had already delivered
Customers reported offensive, fraudulent, or inaccurate content on Vrbo, with 19.3 thousand cases reported since launch.
Accessibility filters added to options, increasing engagement and contributing an estimated 12 percent reduction in preventable bad experiences.
A lodging accessibility guide for partners, with clearer definitions, guidance, and best practices for collecting and entering accessibility amenity information.
A content acquisition campaign and content analysis to improve the quality and display of accessibility information.
New research in previously unexplored areas, including travellers with accessibility needs, partner accessibility, and inclusive reviews.
An accessibility landing page concept, an eighteen-month experience strategy, and new measurement tools including an improved preventable bad experiences model and an accessible travel competitor scorecard.
Early development of an accessibility flag within the universal profile.
What the resource shift put at risk immediately
Personalisation for travellers with accessibility needs, including universal profile development, accessibility signal capture, and validation research with the disability community.
Inclusive reviews, including changes to the reviews form, tagged review flows, and how that information would be displayed to customers.
Accessibility service requests, a 17 percent contributor to preventable bad experiences, including partner research, response improvements, and a closed-loop accountability system.
Anti-discrimination reporting, including reporting entry points, workflows, and research to validate trust with impacted communities.
Accessibility content on property pages, landing experiences, and partner-facing accessibility amenity ingestion work.
Follow-on design support for shipped work such as content reporting and accessible amenity display, limiting iteration, validation, and long-term quality.
Longer-term business impact
The business would continue to expose travellers with accessibility needs to avoidable and inequitable failures across the journey.
Manual service and support costs would remain high where the product experience was still weak, including for wheelchair-related requests.
Marketplace trust would improve more slowly because travellers still could not reliably judge whether an experience would meet their needs before booking.
The company would remain materially behind competitors on accessible travel features and lose time on a roadmap designed to close that gap.
The next phase of the work, which was intended to move from fixing known gaps to building industry-leading experiences and extending the learning to other underrepresented groups, would stall before it could begin.
Cultural signal
Pausing the work also risked sending an internal message that the needs of disabled travellers were easier to defer than other customer priorities.
That signal would affect more than customers. It could also be felt by employees, leaders, and partners who live with disability themselves or support family members with similar needs.
For the business, it raised a credibility question: if a small, high-impact team couldn't keep up as the work gained momentum, how serious was the company about inclusive travel as a long-term priority?
This was already a delivering program, not a speculative one. Pausing it did not reduce risk. It delayed a clear, evidence-based roadmap to reduce customer harm, improve marketplace trust, lower avoidable service costs, strengthen internal confidence, and close a visible competitive gap.


Leadership lessons
Lead the system, not just the screen. The biggest customer failures happened between products, teams, and partners. Design leadership meant connecting those parts and making the hand-offs visible.
Make inclusion measurable. A shared harm measure changed the conversation. It gave people a reason to prioritise accessibility as part of product and business performance.
Use artefacts to create alignment. The strategy, scorecard, prototypes and partner guidance gave different stakeholders a common object to respond to, rather than asking them to align around abstract principles.
Be honest about what you ship and what you propose. Credibility mattered. We distinguished early delivery from longer-term direction and made dependencies and uncertainty visible.
Build momentum that can survive organisational change. A team may not control a programme's future structure, but it can leave behind a clearer strategy, stronger evidence, and better ways of working than it inherited.

Conclusion
In six months, we did not solve accessible travel. We did something more foundational: we helped Expedia Group see the experience as a connected system, made customer harm visible, created a shared strategy, and delivered early improvements to build on.
As design lead, I gave the team clarity, created the conditions for cross-functional progress, and kept the work anchored in the lived reality of travellers with disabilities. The most important outcome was not a single feature. It was a stronger organisational ability to recognise accessibility as a core part of travel quality, customer trust and responsible growth.


Testimonials
Working with Carl on Customer Inclusion and Diversity at Expedia.